The Sampling Framework
Introduction
The objective of sample surveys is to make inference about a population from information contained in a sample selected from that population. We are usually interested in estimating some population parameter such as the population mean, proportion or total.
(1.2) Populations and Representative Samples
A sample is representative if it can be used to “reconstruct” what the population looks like and if we can provide an accurate assessment of how good that reconstruction is.
Key Terms
Some definitions are needed to make the notions of a “population” and a “representative sample” more precise.
- Observational Unit: The singular object that is being measured. A 🐈.
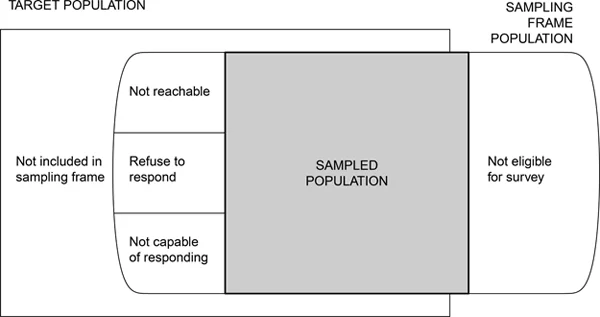
- Target Population: The complete collection of all observational units that we want to study. All 🐈 in Chico.
- Sample: A subset of the population. The 🐈 at Butte Humane Society
- Sampled population: The collection of all possible observational units that might have been chosen in a sample. Adoptable 🐈🐈 in Chico.
- Sampling unit: A observational unit that can be selected for study. A 🐈 available for adoption at BHS.
- Sampling frame: A list, map, or other specification that describes how sampling units from the sample may be selected. The roster of 🐈🐈 listed for adoption at BHS.
In an ideal survey, the sampled population will be identical to the target population. 🦄
Other examples
American Community Survey
- Target Population: Resident Population of the US
- Sampling frame: residental housing units and group quarters
- Observational Unit: Household
- Sample: 3.5 million housing addresses
- Sampled population: person who lives at one place on the list and will participate in survey
- Sampling unit: household on the list
Agricultural survey
- Target Population: All areas of land used for agriculture in a country
- Sampling frame: Random selections from a list of all the areas
- Observational Unit: farm operator
- Sample: Random areas of land
- Sampled population: The list of land in the country
- Sampling unit: Smaller sections of owned land
Literary Digest Election survey
- Target Population: All people who would vote on election day
- Sampling frame: Voter registration datasets
- Observational Unit: A single voter
- Sample: people who read literary digest
- Sampled population: persons on the lists used by the Literary Digest who would return the sample ballot.
- Sampling unit: A single respondent
(1.3) Selection Bias
Selection bias occurs when the target population does not coincide with the sampled population because some population units are sampled at a different rate than intended by the investigator.
❓ If a survey designed to study household income has fewer poor households than would be obtained in a representative sample, would the survey estimates of the average or median household income be too high? or to low?
Too high.
- Convenience Sample: Choosing a sample which is not representative of the target population due to difficulties collecting certain portions/groups of the population response. Example: If I only surveyed everyone in this room to get information about people living in the United States since it’s more convenient, it wouldn’t be representative of all people in the United States.
- Purposive or Judgement Sample: Choosing a sample that would favor in our experiment. An example would be choosing a race against crime rates.
- Self-Selected Sample: The participants of a sample opt in voluntarily to participate. Not representative of larger population. People can sometimes respond more than once skewing the data. Example: Users of a specific website agree to take a survey.
- Undercoverage Bias: The inability to achieve a representative sample because members of the population can not be reached for a variety of reasons (ex. phone surveys cant reach people without phones. Email surveys cant reach people without email addresses…).
- Overcoverage: When observational units that are not part of the target population are included in the sample, this is overcoverage. In plain language, it’s when units that shouldn’t be surveyed are surveyed. This can occur when your sampling frame is too big, so you need to weed-out units that don’t belong in the sample. Units might be double-counted (like a house with two phone numbers getting called twice, or when ecologists both count the same bird).
- Nonresponse: Failing to get responses from the sample, without external sources as to why. EX(Fewer than 1% households agree to participate in a poll.)
What Good Are Samples with Selection Bias?
Can Bias ever be good? Yes! It may provide valuable information, especially in early stages of investigation.
By Oct ’19, over 1,600 cases of lung injuries and 34 deaths were found to be associated with vaping, but the actual cause of injuries were not known. In 2019 a group of researchers (see text for citation) conducted a study that ultimately led to the recommendation that the public stop using these products until more research on the causal association could be conducted.
This impact survey had the following types of selection bias:
- Researchers attempted to interview 83 patients who were reported to have lung injuries but only 53 responded (non-response bias).
- The sampling frame of 83 only came from physician-reported cases, which means there may be bias if the physicians only reported the more serious cases (undercoverage)
- THC is illegal in that state, so patients may have under-reported their use (undercoverage)
- Individuals who vape, incurred a lung injury but didn’t seek care were excluded from the study (undercoverage)
Just because your sample may likely contain bias, being up front about it in your reporting (this is what the limitations section is all about) is a very important aspect of open science.
(1.4) Measurement Error
- Measurement error: When the response differs from the true value
- Measurement bias: When the error tends to only occur in one direction
Often in ecological surveys, areas are divided into plots or grids of smaller size. A sample of plots/grids are selected and the number of plants in those selected grids are counted.
Field researchers have to make a decision about whether or not to count plants directly on the border. If one researcher always counts plants on the boarder as being inside the grid, and another one does not, their estimate will always be higher than the other person.
Surveying people
Obtaining accurate responses is challenging in all types of surveys. Especially when dealing with humans.

- People may choose not to respond or lie if they’re embarrassed about the response (like income level)
- People may misunderstand the question
- People may not remember the information correctly
- People may have incorrect information influencing their response. For example, people may not actually know their ethnic background, only what their parents have told them.
- People might just lie for fun, like putting that they’re a 100 year old bazillionaire in a questionnaire.
- May accidentally respond to the wrong question (online survey)
- people may not care about the survey or forced to do it so speed through it
- May misunderstand the question
- May try to sound good (e.g. how much they donate or would donate to a cause)
- May over estimate own capabilities
- They don’t like the interviewer
- The question is too loaded
- People from different cultures may have different definitions of categorical responses. (Eg. “Very good” may have a different meaning among Italians vs. Americans)
- People may have a language barrier that makes it hard for people to answer
- They might feel unsecure disclosing certain information.
- if someone has done something illegal and fears repurcusions.
- does not want answers traced back to themselves
- Genuinely just dumb (taking a survey they know nothing about)
- Not being self-aware (being asked questions about self, thinks too highly or too lowly)
- overexaggerate a ‘positive’ thing and understate to a negative
- Self incrimination
Clear sampling protocols and thoughtful & validated survey design can minimize measurement error.
(1.5) Questionnaire Design
This is a short, short version of how to design a questionnaire. If you are considering writing one for a project or thesis, please consult one of the references at the end of the chapter in the textbook.
Be as precise as possible
“I want to learn something about persons experiencing homelessness”
Is not good enough. Let’s revise this to
“What percentage of persons using homeless shelters in Chicago between January and March 2021 are under 16 years old?”
Now you can write questions that will be able to actually answer this research question.
Guidance
- Test the questions before administering the survey.
- Before you follow through with the survey, you should test the questions in a smaller sample within the target population to ensure that there is no misintepretation on the questions.
- In other words, test your questions(for clarity) on a very small sample before conducting a mass scale survey.
- Keep it simple and clear
- The idea is the simpler question is easy to give an accurate answer.
- Keep language at a comprehendable level to your audience
- Try to get an answer for one variable/parameter at a time per question
- Define your terms - Be as specific as possible in your language. When there is ambiguity be explicit in what you are asking. Words mean different things to different people; be clear about your meaning. Ex. is a truck a car?
- Relate your questions to the concept of interest.
- Ensure questions are directly correlating to what we want to learn, some surveys created mislead information due to the questions being too broad or too specific Example: Testing for income levels and including a question about depression
- Decide whether to use open or closed questions
- Using open and closed questions each have their advantages and disadvantages. If you use open questions, the respondent can choose any answer that they feel is appropriate, but there might be some things that don’t come to mind. If you use closed questions, you can give the respondent a few ideas that they might forget about, but they might feel limited to just those options.
- Pay attention to response option scales - People tend to prefer responding when there is a neutral middle option to use as a reference for describing their opinions. ex: people prefer a five point scale to a six point. What “fairly happy” means is dependent on what the other options are, ie number of options worse or better than that option.
- Avoid questions that prompt or motivate the respondent to answer in a particular way. Avoid “loaded” questions which try to influence the respondent by using very positive or negative words.
- Eg. “Would you rather increase funding for the music program (like any good community member would), or shut down the school altogether?”
- Consider the social desirability of responses to questions, and write questions and use modes that elicit accurate responses. People are more likely to over-report positive activities and under-report negative activities.
- Eg. Respondents underreporting cigarette use to the question “how many packs do you smoke in a week?”
- Eg. “How much money loss to stop gambling in one session?”
- (Don’t not) avoid double negatives; they’re needlessly confusing and might cause the respondent to answer in the exact opposite way they intend.
- Example from the book: “Do you favor or oppose not allowing drivers to use their cell phones while driving?” The double negative is “do you oppose not allowing…” This could be written as “Do you support or oppose a ban on cellphone use while driving” to alleviate the needless confusion.
- Instead of “do you oppose not drilling for oil” should be asked as “do you support drilling for oil?”
- Another example, not from the book that would be considered confusing is “do you not disagree with this question?”
- Example from the book: “Do you favor or oppose not allowing drivers to use their cell phones while driving?” The double negative is “do you oppose not allowing…” This could be written as “Do you support or oppose a ban on cellphone use while driving” to alleviate the needless confusion.
- Use forced-choice rather than agree/disagree questions
- People answer differently if it’s a yes/no versus a multiple forced-choice option
- Examples from the book include: “Do you agree or disagree with this statement ‘most men are better suited emotionally for politics than are most women’” or “Would you say that most men are better suited emotionally for politics than are most women, that men and women are equally suited, or that women are better suited than men in this area”
- Interpretation: What they found was that if it was a yes or no, people tend to lean toward yes if they had less schooling meanwhile if you are given options, a portion of the men that originally said “yes” were now spread across education levels
- Ask only one concept per question
- Keep the questions as simple and straight forward. With two questions someone might agree with one but disagree with the other. The data is then wrong when two questions should of been asked.
- Example: Did you vote for Obama and should healthcare be free.
- Pay attention to question order effects.
- Question and answer may affect response to following questions
- Emotionally loaded question may affect following question towards a bias
- Try to ask questions that may be emotionally disconnected from each other
- Government spending vs government control
(1.6) Sampling and Nonsampling errors
- Most surveys report a “margin of error”, often something like “3 percentage points”
- The margin of error describes the sampling error - that is the error that occurs from taking one random sample instead of measuring the entire population.
- Nonsampling errors cannot be attributed to the sampling variability, but due to selection bias and measurement error.
(1.7) Why use sampling?
“After all, my opinion has never been asked, so how can the survey results claim to represent me?” “Extrapolating what tens of millions are thinking from a tiny sample of opinions affronts human intelligence and negates true freedom of thought.”
Public distrust of surveys intensify when high stakes elections (1936, 2016) are predicted incorrectly.
Initial recommendations to use a sample to understand a characteristic about a population developed in Norway in 1895, but it wasn’t until 1920-1960 that statisticians were able to create mathematical proofs to support that a probability sample - a sample chosen using random selection methods - produces reliable results that can be used to make inference on a population.
Advantages of a sample instead of a census
- Lower cost
- less time consuming
- fewer errors?
- higher quality of data/ more efficient / reliable information
- Predicting trends/coming to conclusions faster(relevance of information after a certain time or time deadline )
- Calculable Sampling Error, estimate your uncertainty
- Can identify invalid measurements
- Higher quality information
- It’s easier to manage a sample than a census
- Census may cause behavior change in surveyee
“Sampling is not mere substitution of a partial coverage for a total coverage. Sampling is the science and art of controlling and measuring the reliability of useful statistical information through the theory of probability” (Deming, 1950, p. 2)
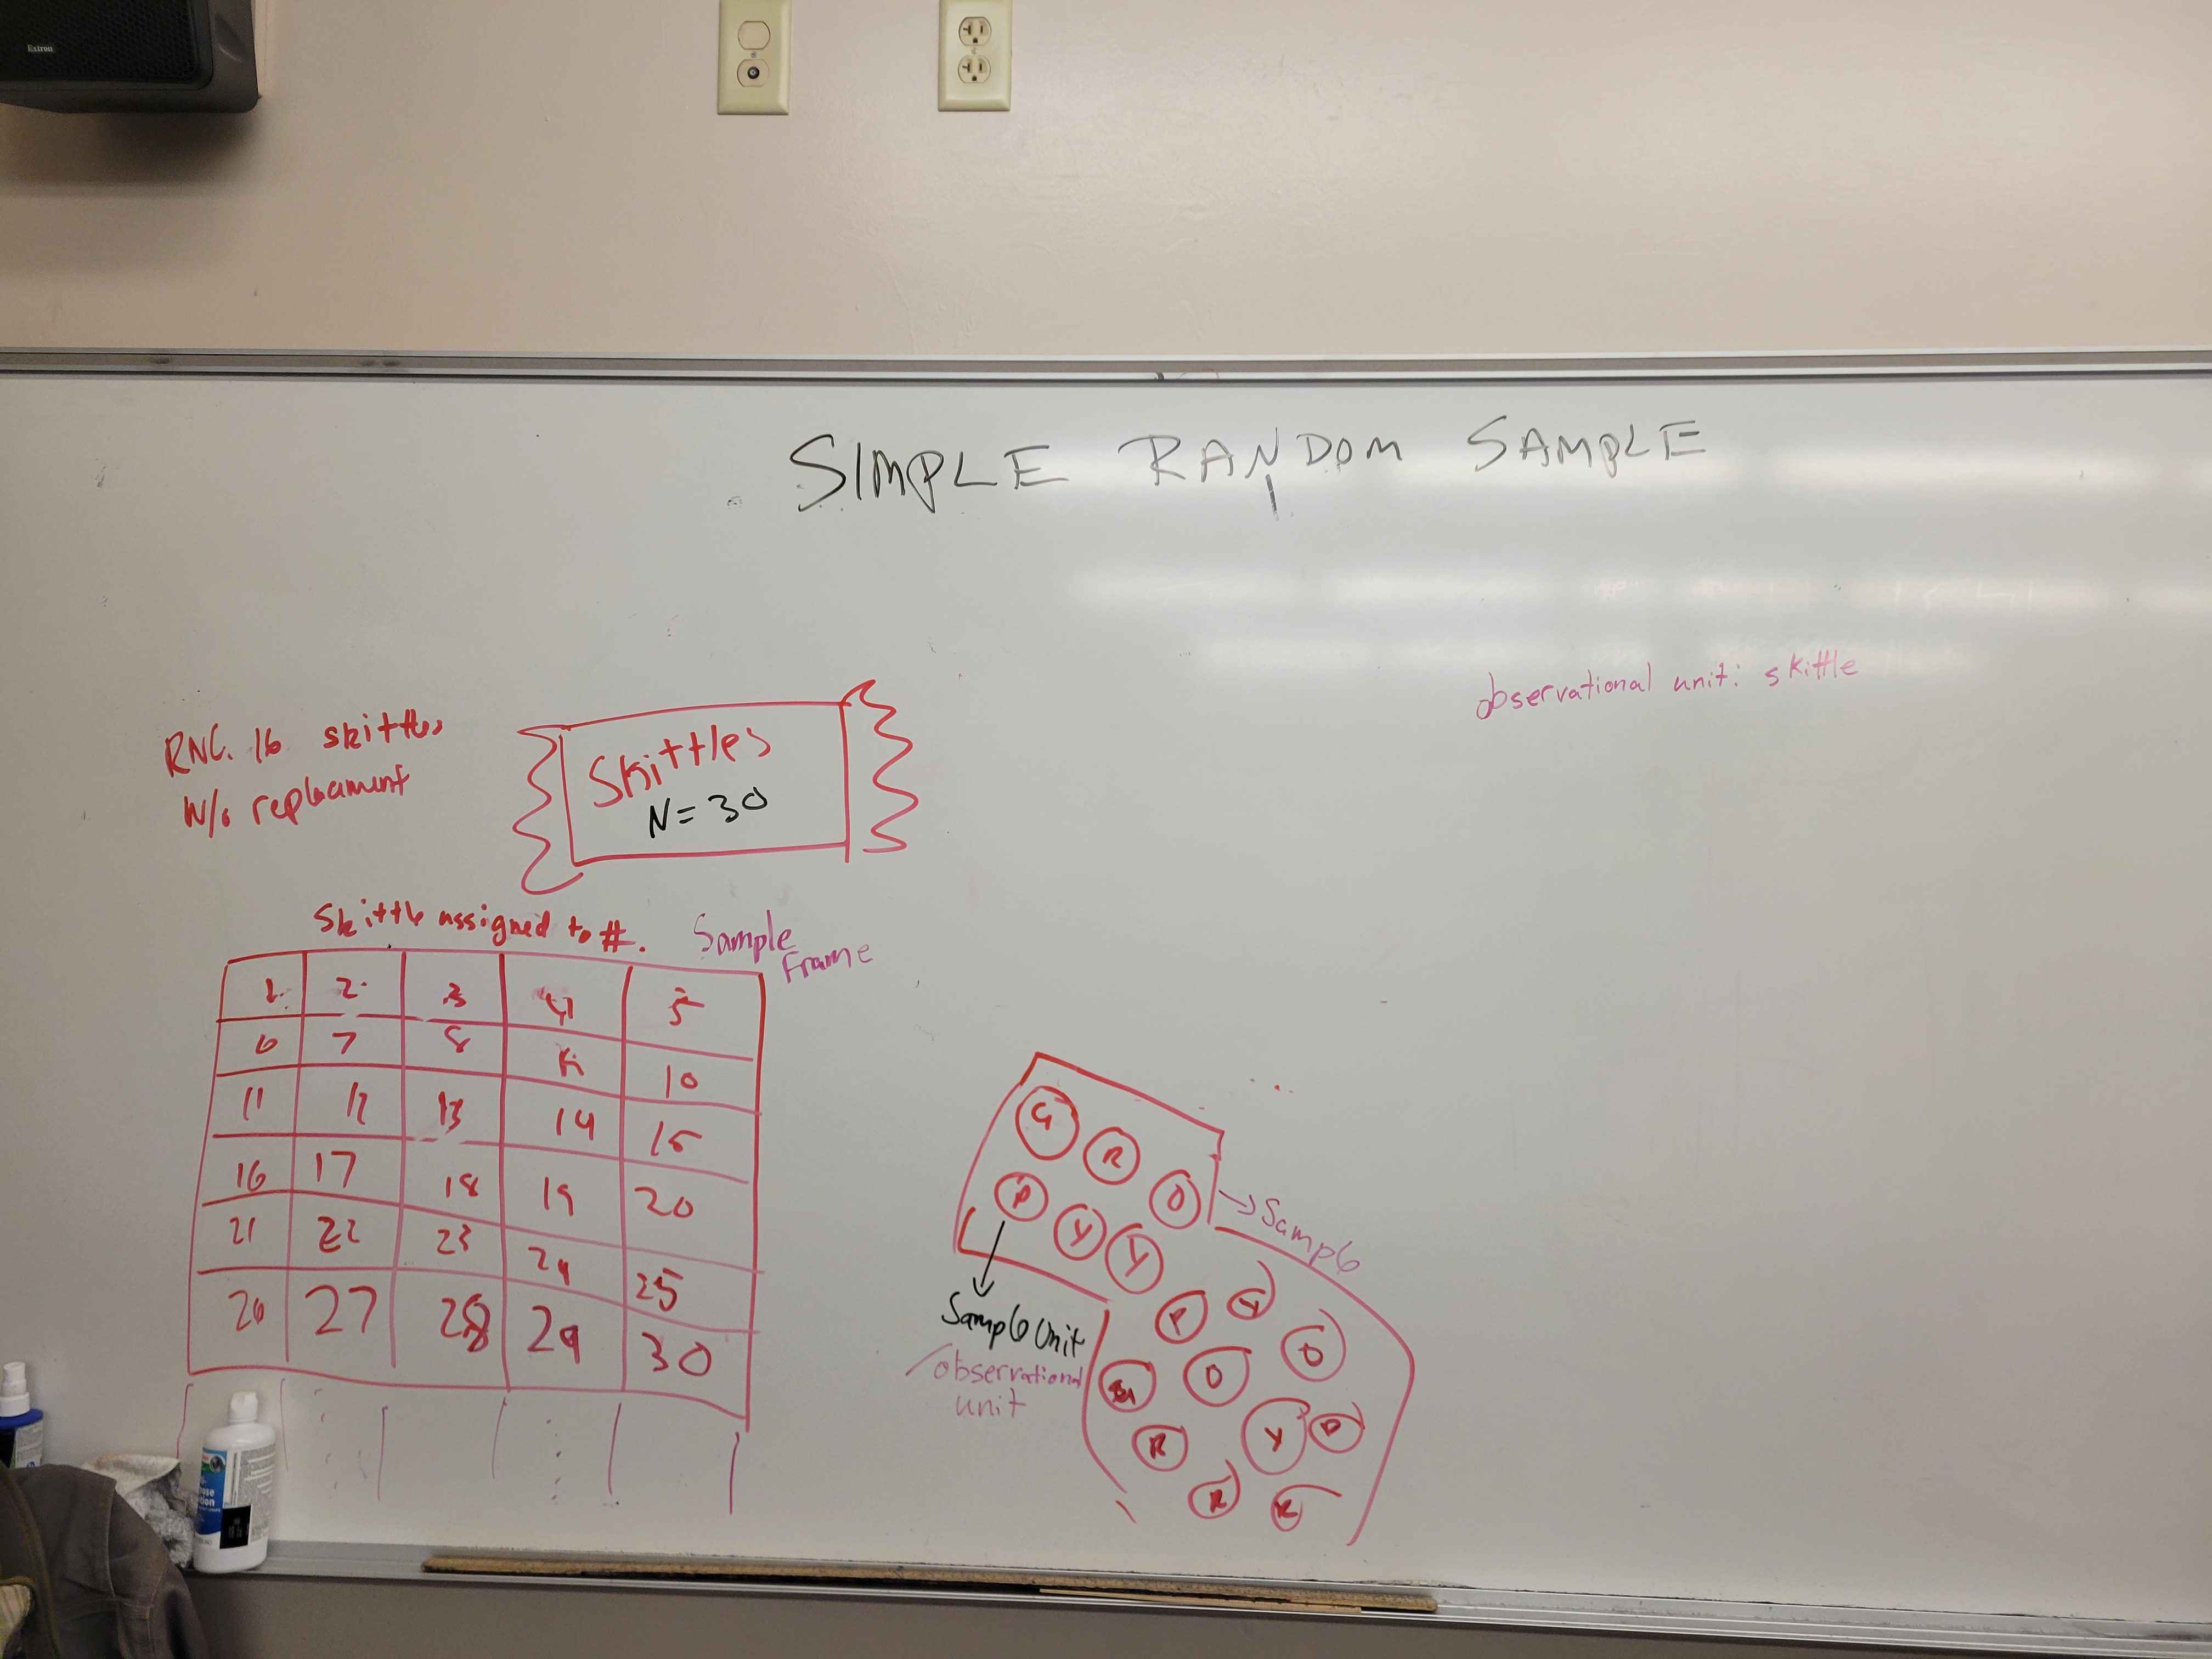
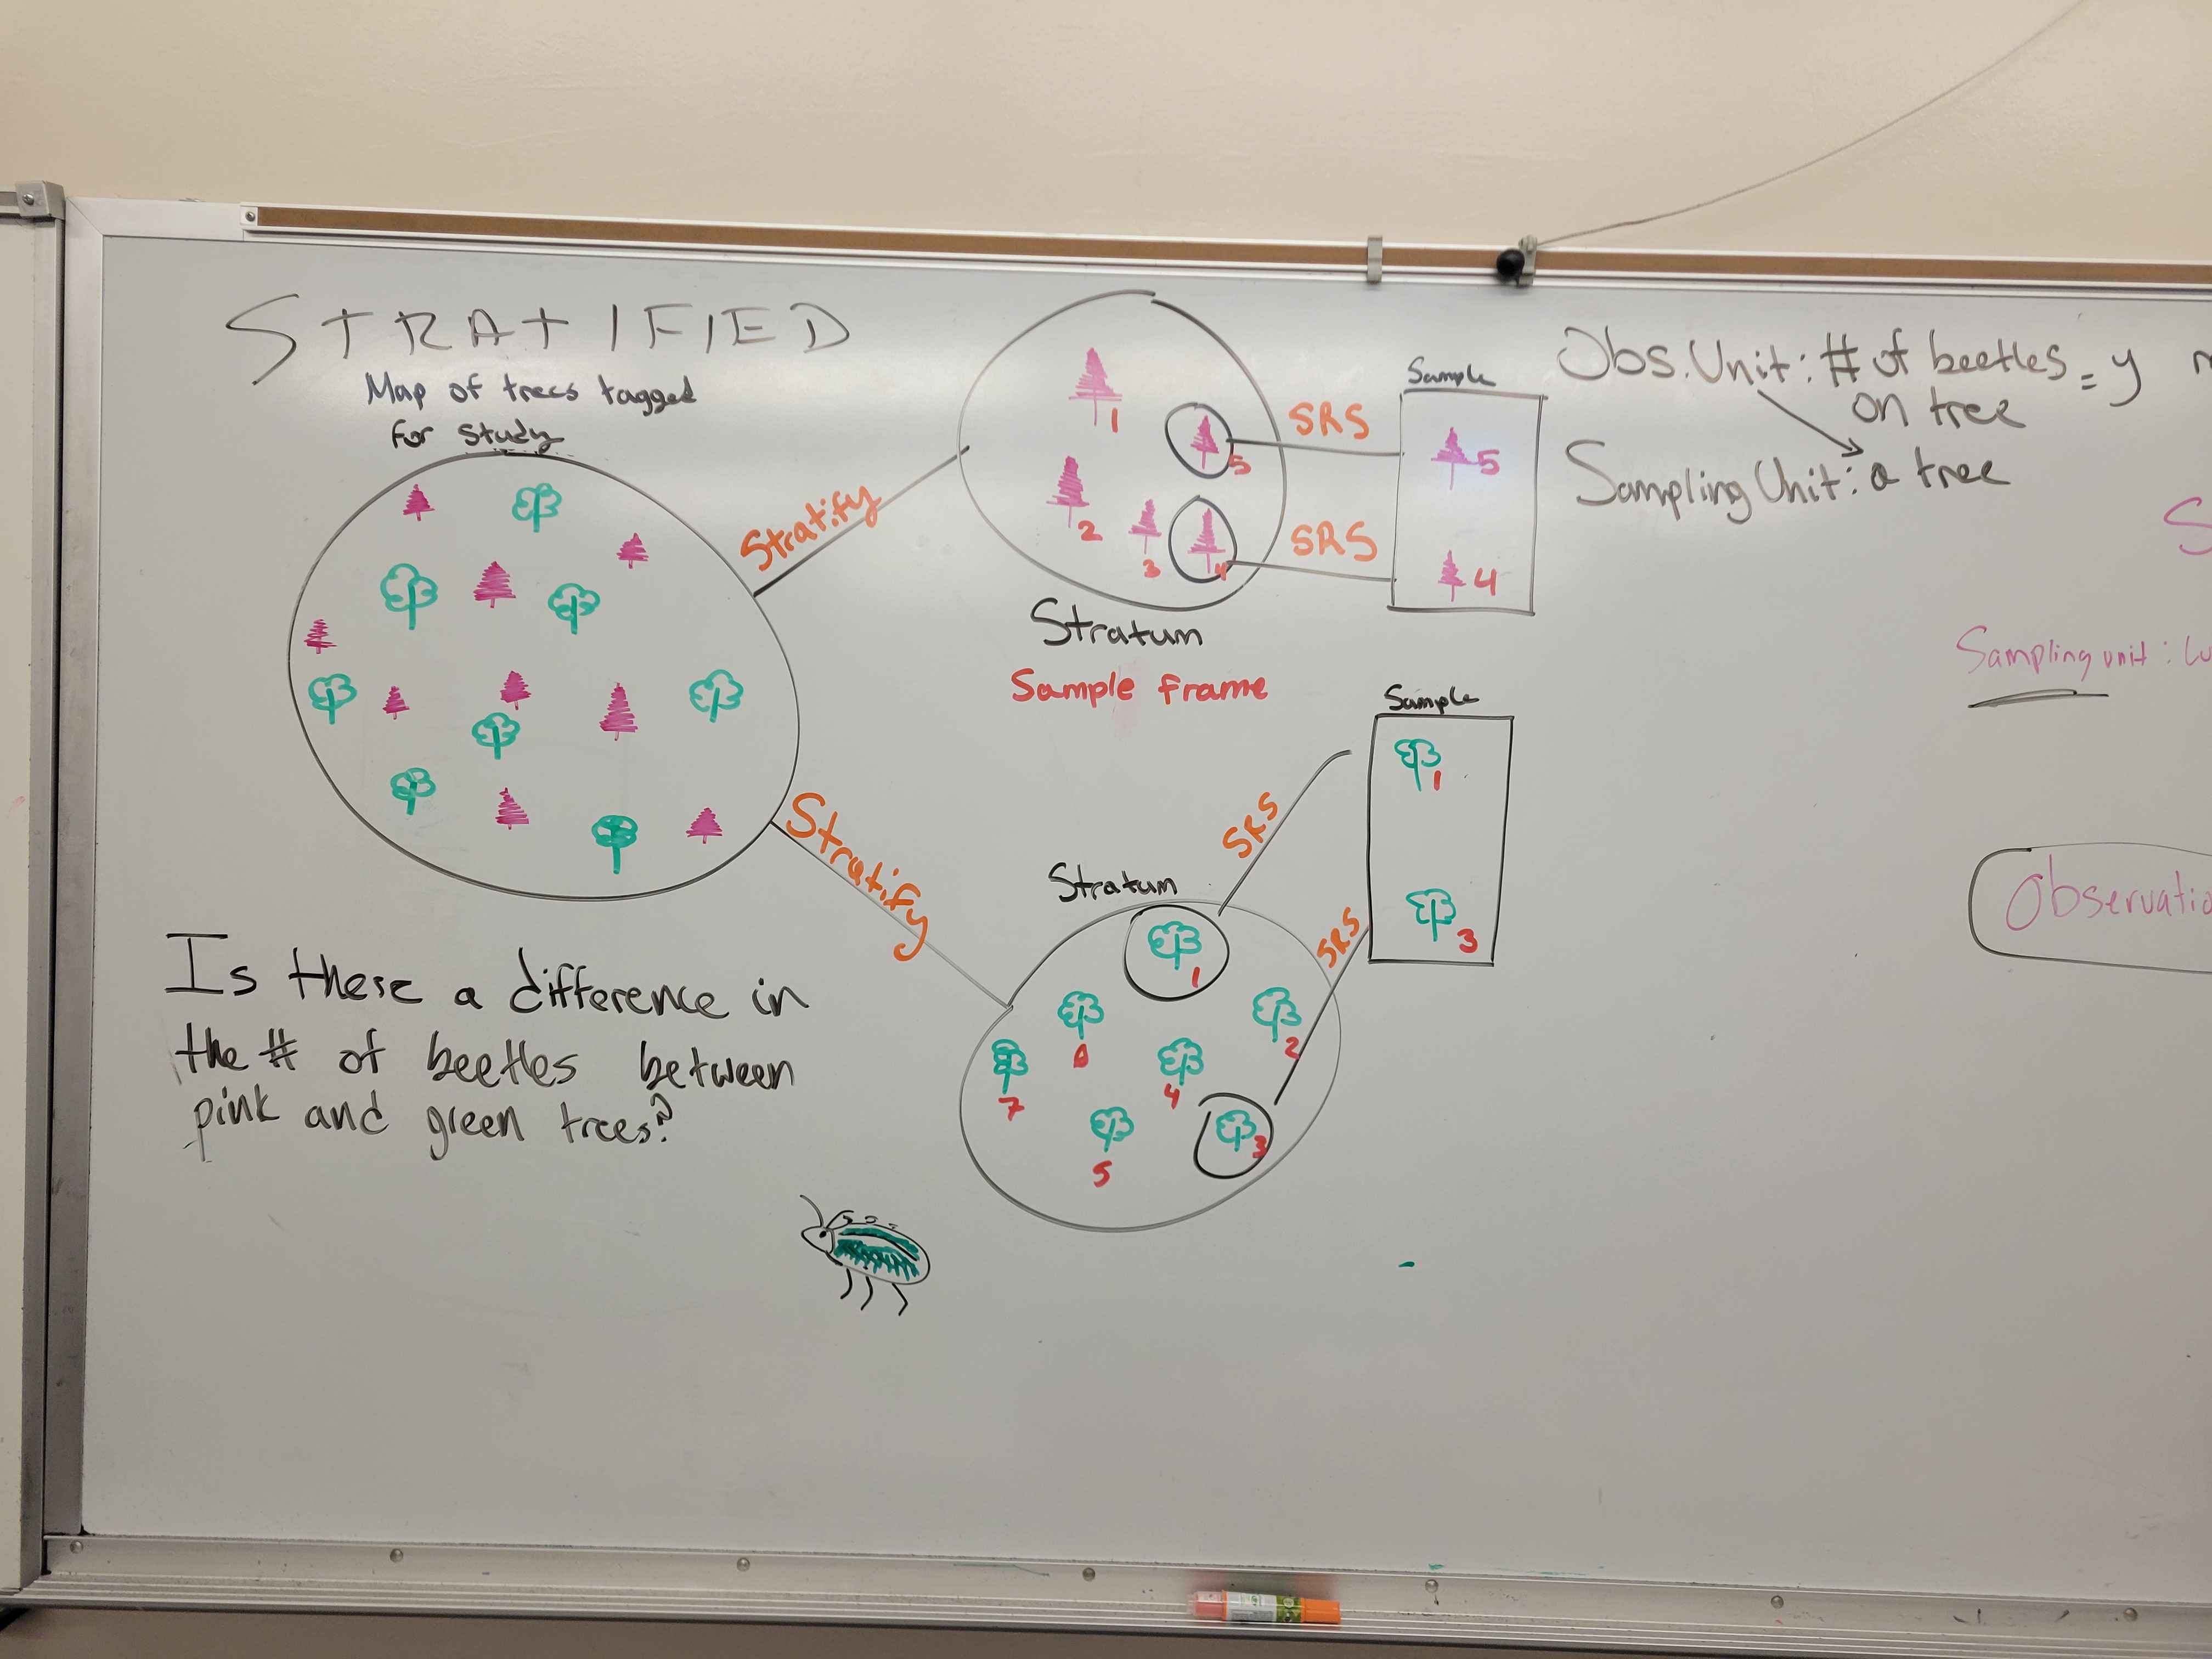
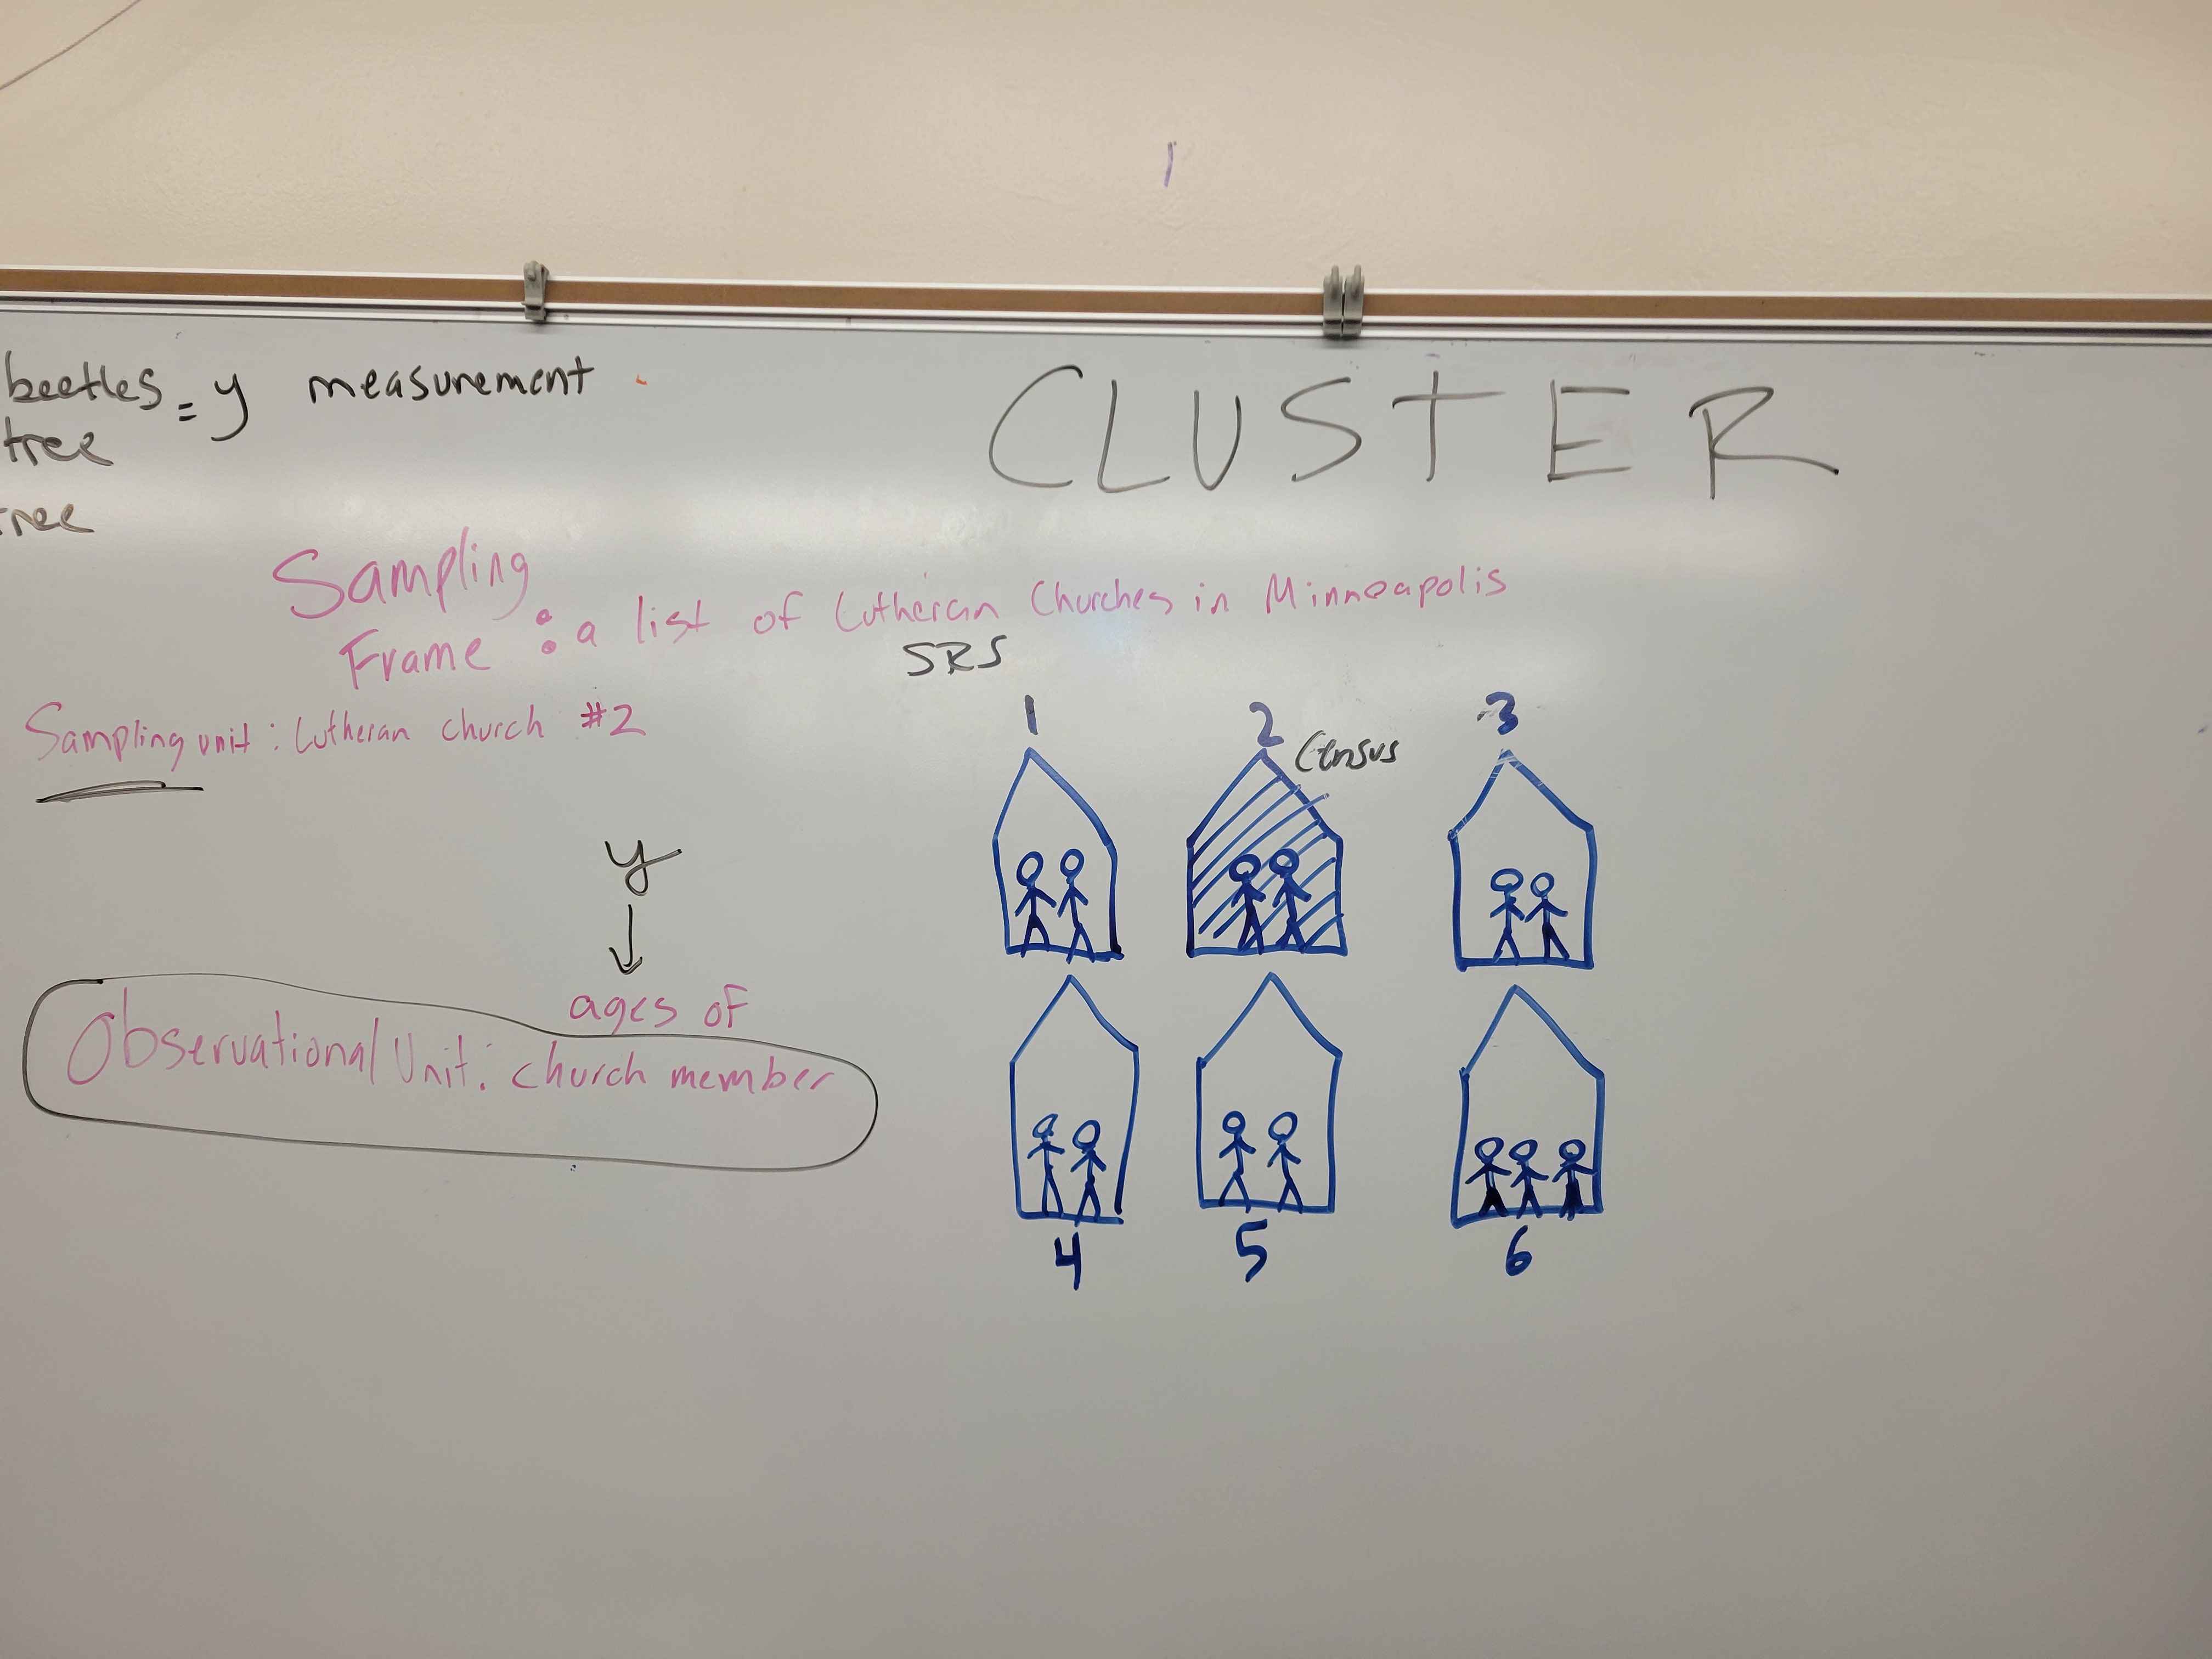
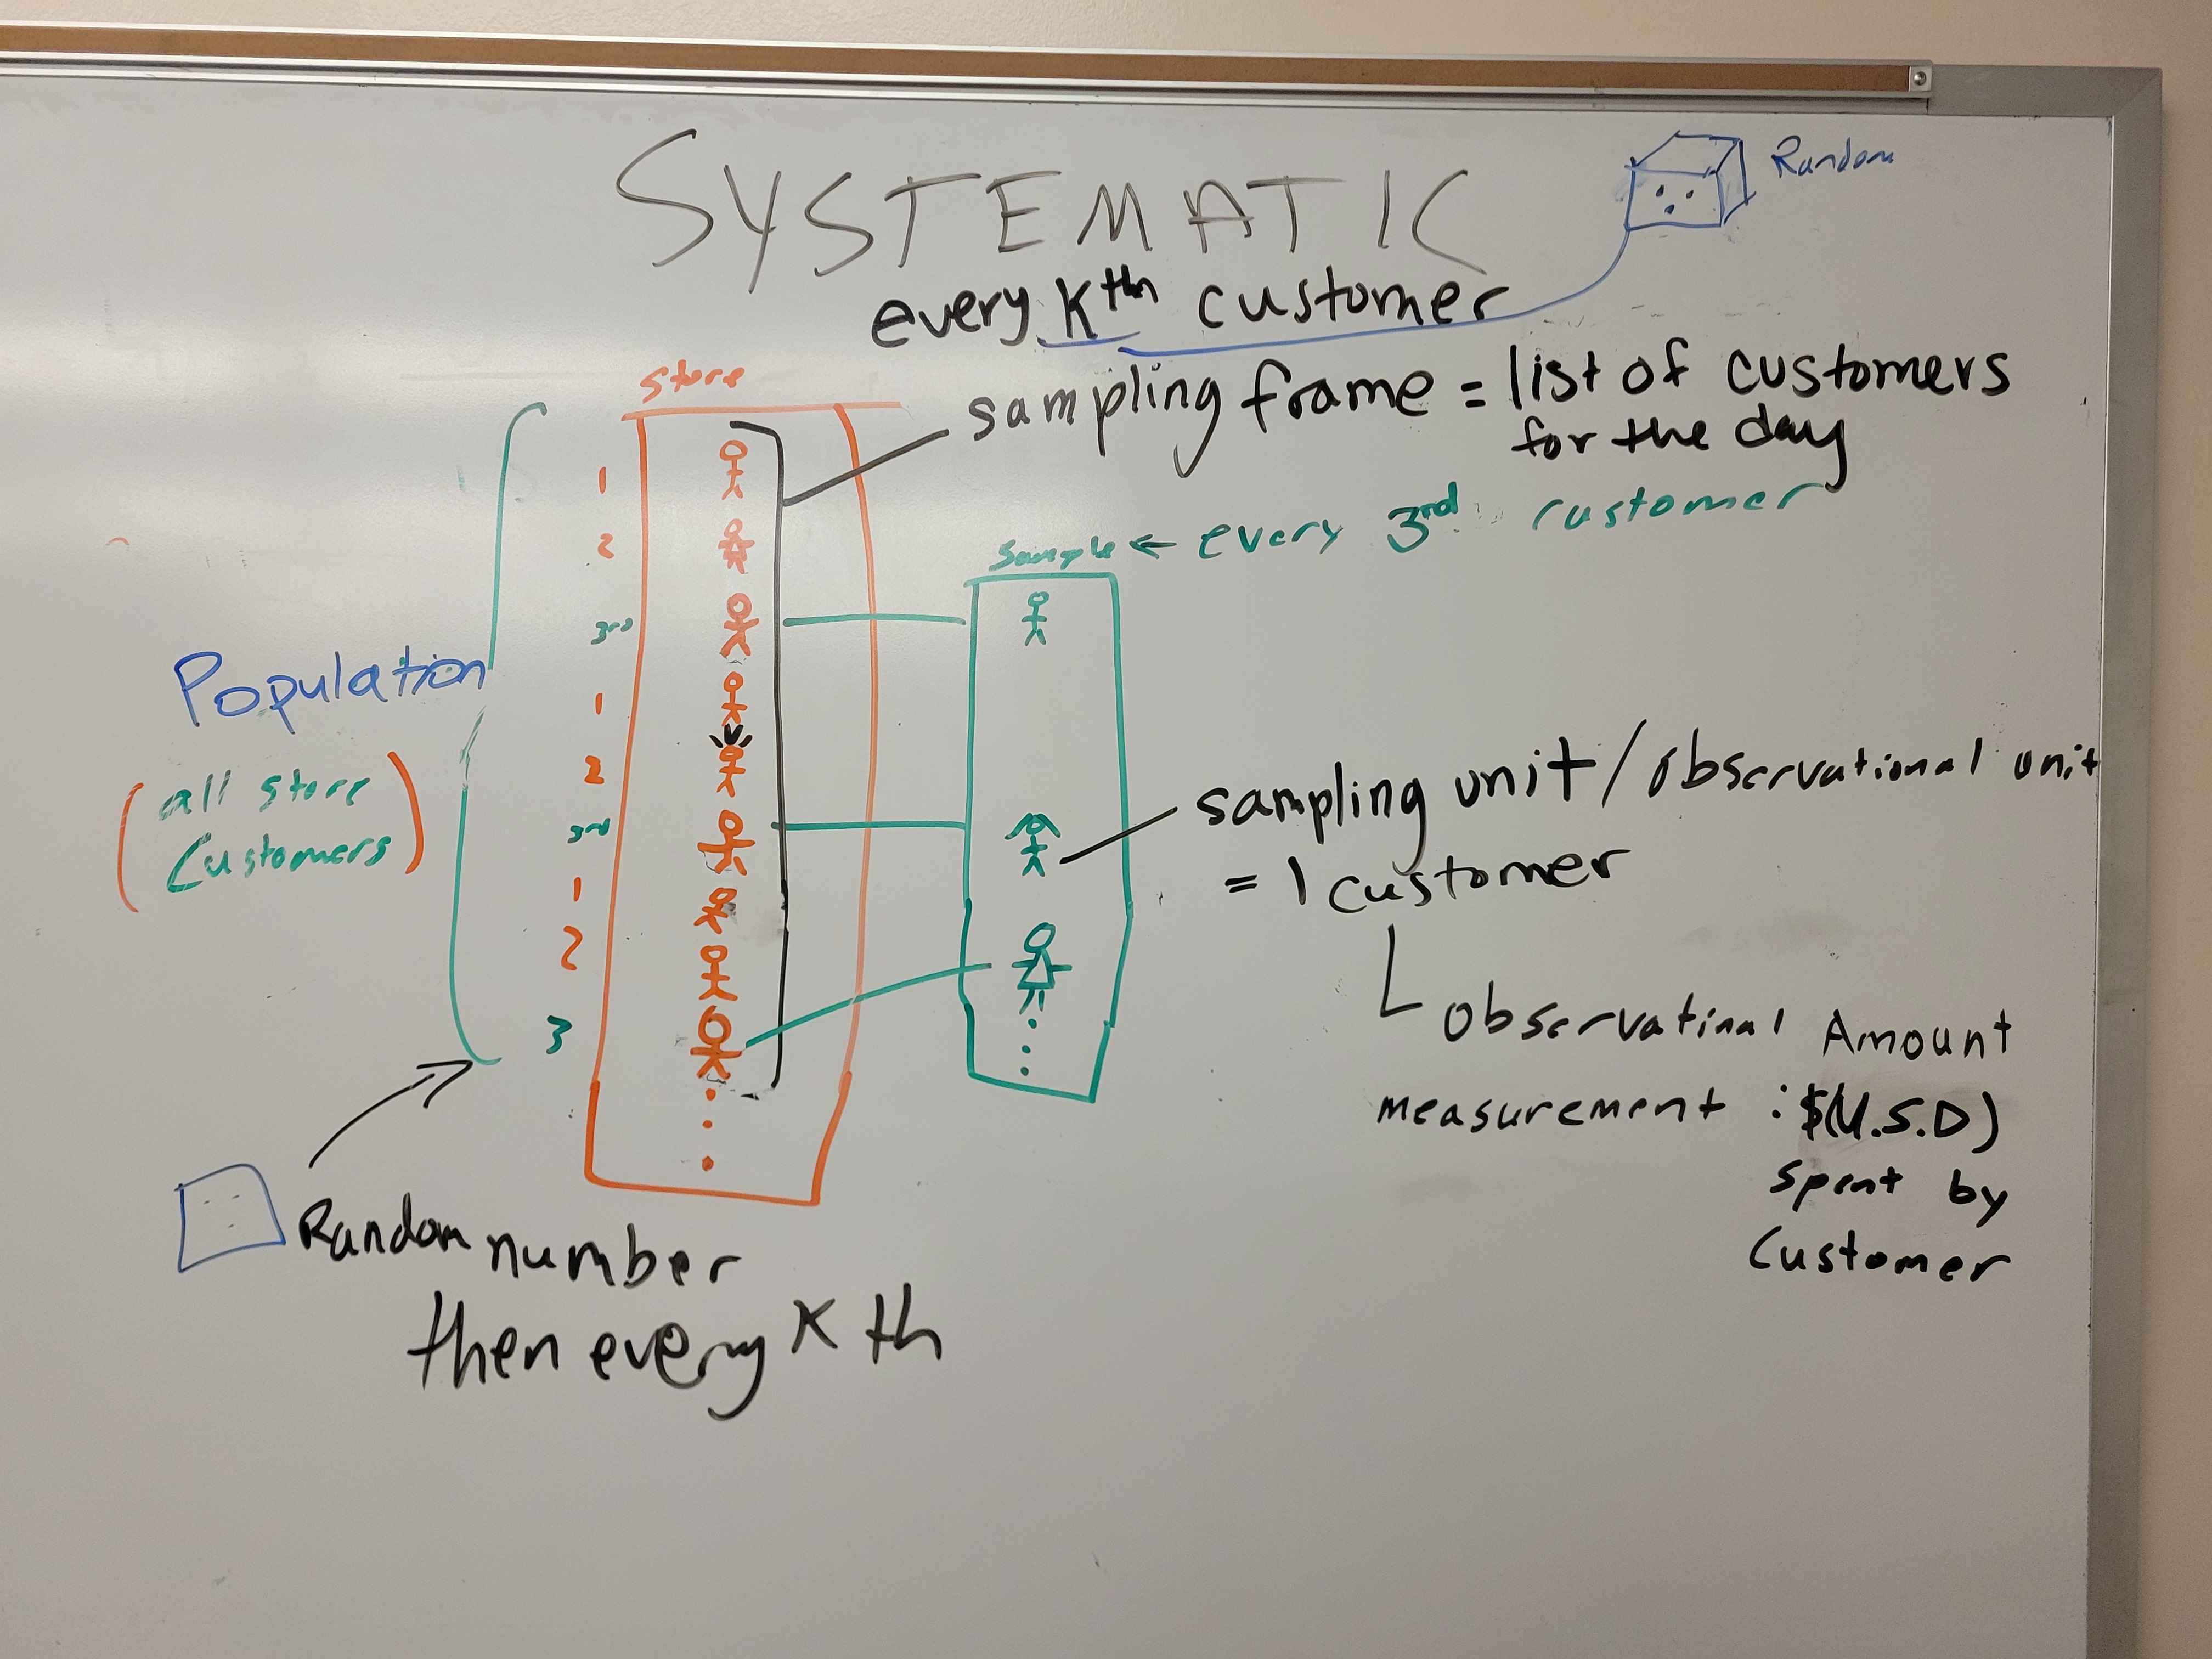
(2.1) Types of Probability Sampling
In this class we assume:
- sampled population is the target population
- the sampling frame is complete
- that there is no nonresponse or missing data
- there is no measurement error